Last Updated: 2026.01.15
to Japanese page
 Data Download
 Consolidated figures for the most recent quarter and the past years (Excel) (63KB)
 Performance by Group Operation (100KB)
IFRS
Unit: Million Yen
| FY2021 | FY2022 | FY2023 | FY2024 | FY2025 | |
|---|---|---|---|---|---|
| Profit attributable to owners of the parent | 169,847 | 273,335 | 296,229 | 371,999 | 433,009 |
| Total equity | 1,162,298 | 1,615,402 | 1,873,360 | 2,068,254 | 2,327,501 |
| Non-controlling interest | 45,813 | 53,750 | 51,955 | 51,718 | 54,385 |
| Total assets | 2,509,976 | 3,183,762 | 3,303,694 | 3,587,565 | 3,859,353 |
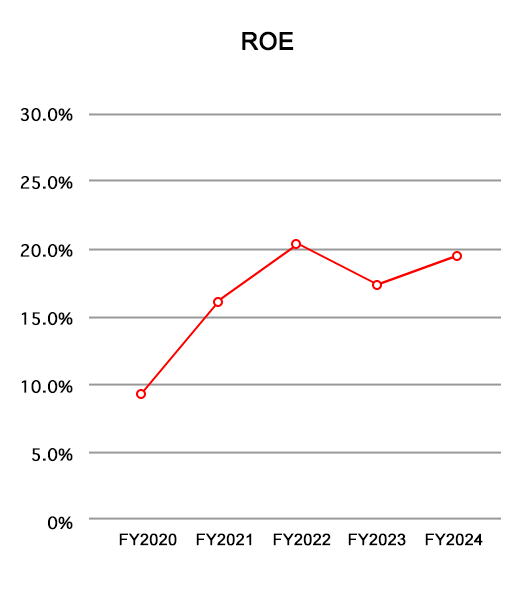
| ROE (%) | 16.4% | 20.4% | 17.5% | 19.4% | 20.2% |
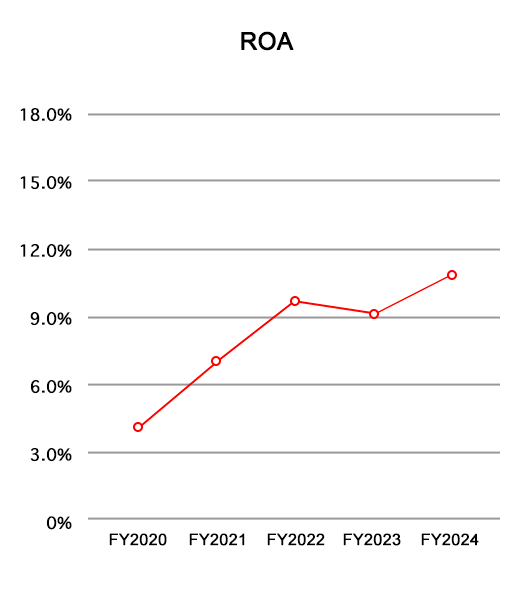
| ROA (%) | 6.9% | 9.6% | 9.1% | 10.8% | 11.6% |
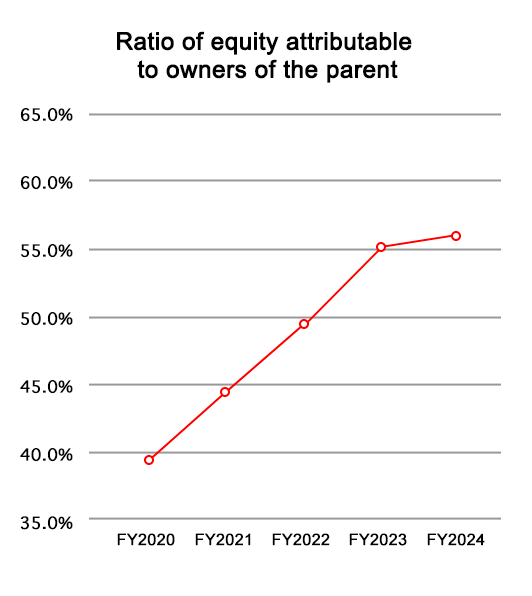
| Ratio of equity attributable to owners of the parent | 44.5% | 49.1% | 55.1% | 56.2% | 58.9% |
*FR adopted IFRS from fiscal 2014.
*ROE (Return on equity) =Profit attributable to owners of the parent/average equity attributable to the owners of the parent over the business period
*ROA (Return on assets) = Profit attributable to owners of the parent/average total assets over the business period
*Ratio of equity attributable to owners of the parent=Equity attributable to owners of the parent/Total assets
*Equity attributable to the owners of the parent=Total equity-Non-controlling interests


